Strait of Hormuz oil flow: estimates range from 7.4 to 13 million barrels a day
There is no single official, live count of the oil leaving the Persian Gulf, and the numbers in circulation disagree. Kpler puts crude through the strait at about 7.4 million barrels a day in September; Energy Secretary Chris Wright says almost 13 million. Satellite trackers see only a few ships a day. Here is what each source measures, when it was last updated, and how the disruption shows up in the $4.48 national average for regular.
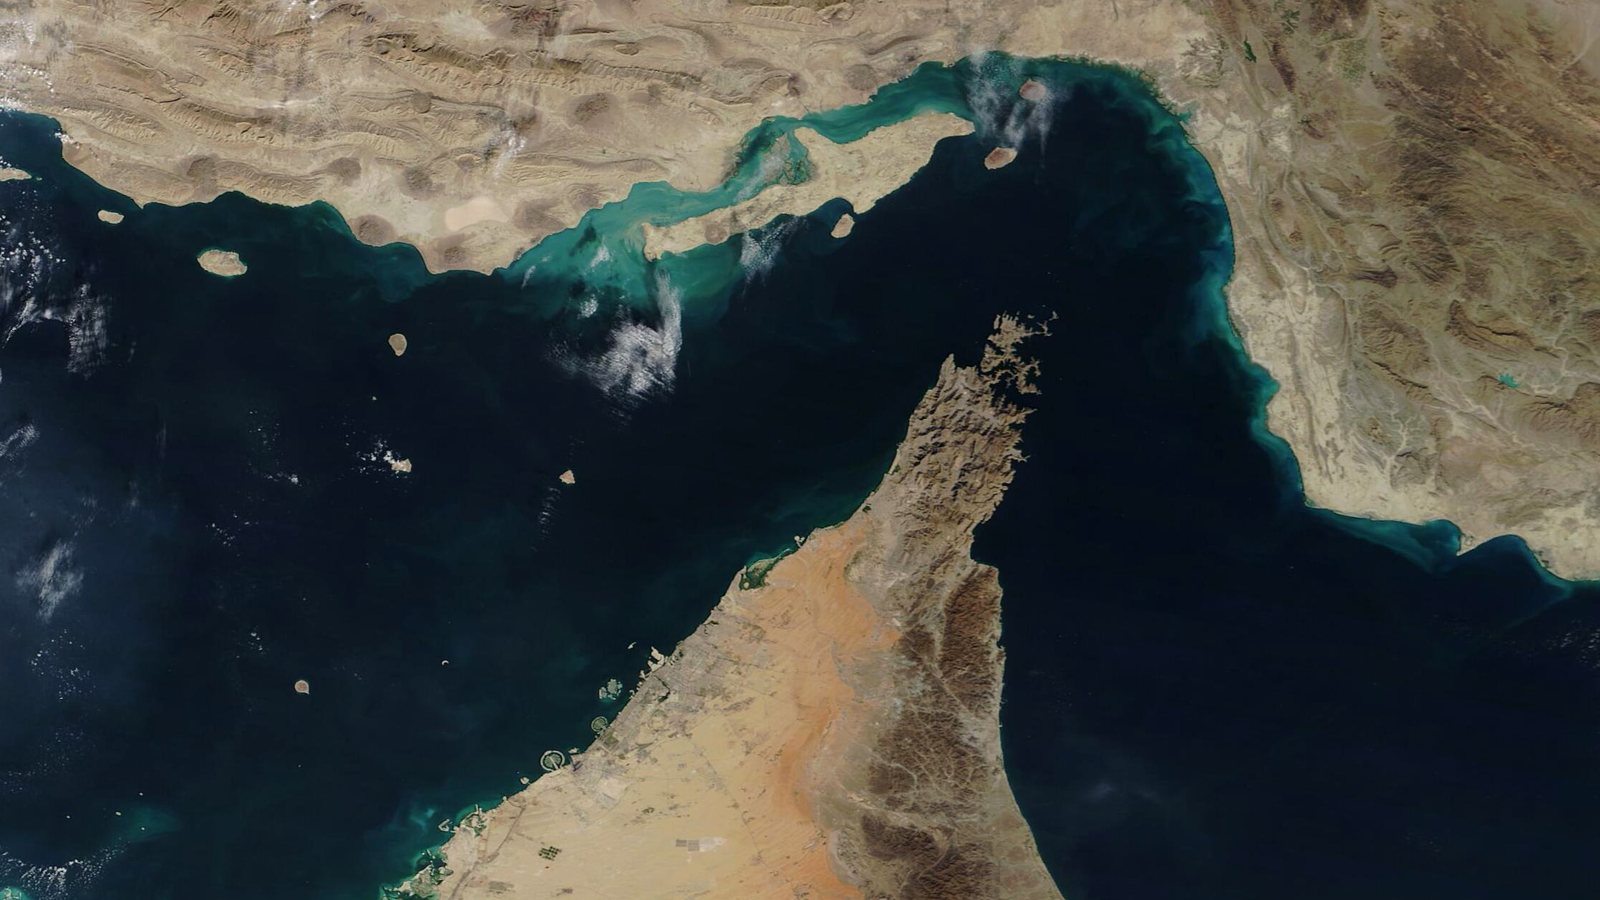
The Strait of Hormuz on September 29: what is confirmed
Oil is moving again, but well below the level before the conflict began on February 28, and nobody publishes a live, verified barrel count.
Before the conflict, about 20 million barrels a day of crude oil and fuels crossed the strait, according to the International Energy Agency: nearly 15 million of crude and around 5 million of products in 2025, a quarter of all the oil traded by sea. The U.S. Energy Information Administration puts the 2024 flow at the same 20 million barrels a day, about a fifth of world consumption.
Seven months on, the picture is mixed. The IEA estimated total Gulf exports at about 13 million barrels a day in August, "nearly half their pre-war level", counting pipelines that avoid the strait. Kpler's preliminary data, reported by Reuters on September 28, has crude exports through Hormuz on track for about 7.4 million barrels a day in September, the most since the war began, as Saudi Arabia sent more cargoes out of Ras Tanura inside the Gulf. The Joint Maritime Information Center, which advises merchant ships, still rated the strait's threat level severe on September 27.
Talks have not reopened the strait. Iran offered last week to reopen it within seven days if the U.S. lifted its naval blockade and oil sanctions; President Trump rejected the plan on September 26, and Tehran said it would keep its conditions.
crude and fuels through the strait in 2025, a quarter of seaborne oil trade (IEA)
total Gulf exports in August including bypass pipelines, nearly half the prewar level (IEA, September 11)
Middle East crude production shut in during August (EIA, September 9)
crude the U.S. imported through Hormuz in 2024, 7% of U.S. crude imports (EIA)
How much oil is getting through: every estimate, with its date
The figures quoted in the news do not measure the same thing. Some count ships, some count barrels, some include pipelines that bypass the strait.
| Source | What it counts | Latest | Date |
|---|---|---|---|
| IMF PortWatch (satellite AIS) | All ships crossing with transponders on | 3.1 a day, of which 0.6 tankers (2025: 85.5 and 48.2) | Sep 14–20 |
| JMIC Update 100 (U.S. NCAGS data) | U.S.-facilitated transits | 89 in 72 hours, about 30 a day (2025 baseline: ~138) | Sep 24–26 |
| JMIC Update 100 (independent tracking) | Non-facilitated cargo ships | Single digits in each direction | To Sep 27 |
| Kpler, via Reuters | Crude exported through the strait | About 7.4M barrels a day, preliminary | September |
| Kpler, via Reuters | Crude through the strait, weekly | 33.7M barrels on 19 tankers; 49.2M the week before | Sep 20–25 |
| Kpler, via Reuters | Middle East crude exports, all routes | 12.8M barrels a day (February: 18.8M) | September |
| U.S. Energy Secretary | Oil out of the strait, running average | "Almost 13 million barrels a day" | Sep 27 |
| IEA Oil Market Report | Gulf exports, all routes | About 13M barrels a day | August |
IMF PortWatch: daily chokepoint transit calls for the Strait of Hormuz, averages calculated by us from the data published through September 20, 2026. JMIC: Update 100 to JMIC Advisory Note, 27 September 2026, 15:00 UTC. Kpler figures are preliminary and come from a private tanker-tracking firm; we quote them as reported by Reuters.
Ship counts are the lowest numbers because they rely on the Automatic Identification System, the transponder signal that satellites pick up. The JMIC warns that ships transiting "with AIS-on" face elevated risk and directed radio hails, and reports persistent GPS jamming and spoofing across the area. Many crossings therefore do not show up on public maps. IMF PortWatch says the same in its notes on conflict areas.
Barrel counts are higher because firms such as Kpler and Vortexa combine transponder data with satellite imagery, port loadings and cargo records. Their numbers are preliminary and move from week to week: Kpler counted 49.2 million barrels of crude out through the strait in the full week before September 20, and 33.7 million in the first six days of the following week, on 19 tankers.
Regional export totals are higher still because they include oil that never enters the strait: Saudi crude piped west to Yanbu on the Red Sea, and Emirati crude piped to Fujairah on the Gulf of Oman. That is why the IEA's 13 million barrels a day for August and Kpler's 12.8 million for September are not strait flows. The Energy Secretary's figure of almost 13 million a day refers to the strait itself and is well above Kpler's; no method was given with it.
The fair reading on September 29: on Kpler's count, crude is leaving through Hormuz at about half the 15 million barrels a day the IEA measured for 2025, Middle East crude exports by all routes are about two-thirds of February's, and the numbers can swing by millions of barrels from one week to the next.
Where the strait is, and the routes around it
The satellite image at the top of this page shows the whole choke point: Iran to the north, Oman's Musandam Peninsula pointing into the channel from the south.
The strait joins the Persian Gulf, on the left of the image, to the Gulf of Oman and the Arabian Sea, on the right. NASA describes it as only about 21 miles wide at its narrowest point and roughly 96 miles long. Every tanker loading in Kuwait, Iraq, Qatar, Bahrain or at the Saudi and Emirati terminals inside the Gulf has to pass through it.
Ships now use two routes. The JMIC's advisories describe a "northern Iranian-controlled route" and a southern corridor along the Omani coast, where U.S. naval forces coordinate transits. MARAD, the U.S. Maritime Administration, keeps an advisory in force for the Persian Gulf, the strait and the Gulf of Oman: 2026-011, which replaced advisory 2026-004 and runs until March 8, 2027. The earlier version told U.S.-flagged ships to plan their voyages with the Navy's shipping coordination center and to stay as far as possible from Iranian waters.
| Route around Hormuz | Status | Source |
|---|---|---|
| Saudi East-West pipeline to Yanbu (Red Sea) | Pumping stations damaged September 10–11; restart at a reduced rate reported September 22; full capacity in six to eight weeks, an industry estimate | JMIC, September 27 |
| Yanbu exports | Down by about half in August from July, before the September damage | EIA STEO, citing Vortexa |
| UAE pipeline to Fujairah (Gulf of Oman) | About 1.8M barrels a day earlier in the crisis; new bypass capacity expected mid-2027 | IEA; EIA STEO |
| All bypass routes together | 3.5 to 5.5M barrels a day of spare capacity before the crisis | IEA |
What the Hormuz disruption has done to U.S. gas prices
The United States buys little oil through Hormuz, but crude is priced on a world market. When a fifth of the world's supply struggles to get out, every refinery pays more for it.
| Region | Feb 23 | Sep 21 | Change |
|---|---|---|---|
| United States | $2.937 | $4.478 | +$1.541 |
| East Coast | $2.834 | $4.285 | +$1.451 |
| Midwest | $2.675 | $4.386 | +$1.711 |
| Gulf Coast | $2.532 | $3.972 | +$1.440 |
| Rocky Mountain | $2.662 | $4.510 | +$1.848 |
| West Coast | $4.111 | $5.600 | +$1.489 |
| California | $4.441 | $6.003 | +$1.562 |
Regular gasoline, all formulations, weekly retail averages from the EIA's Gasoline and Diesel Fuel Update. February 23 is the last reading before the conflict began on February 28; September 21 is the latest published week.
a gallon: the rise in the crude cost alone, from Brent at $71.32 a barrel on February 27 to $114.89 on September 22, divided by 42 gallons
more to fill a 15-gallon tank with regular at the national average: $67.17 against $44.06 before the conflict
national diesel average, the highest in the EIA's weekly series, up $2.72 since February 23
the all-time high for regular, June 13, 2022; this year's peak so far is $4.500 on May 11
In 2024 the U.S. imported about 0.5 million barrels a day of crude through Hormuz, 7% of its crude imports and 2% of its oil consumption, according to the EIA. The link to the pump is price, not supply. Brent, the world benchmark, went from $71.32 a barrel on February 27 to a 2026 high of $138.21 on April 7, and was $114.89 on September 22, the latest EIA daily figure. On our calculation, that September level adds about $1.04 to the crude in every gallon compared with February, roughly two-thirds of the $1.54 rise in the national average for regular.
Most of the rest is refining. Wholesale gasoline on the Gulf Coast rose from $1.968 a gallon on February 27 to $3.891 on September 22, faster than the pump price, and pump prices follow wholesale with a lag. The same squeeze hits diesel harder: the Gulf exported a lot of ready-made diesel, and the IEA says those exports were "just over a quarter of pre-war levels" in August. Our price breakdown splits this week's gallon into crude, refining and taxes, and the diesel page has the same figures by region.
The cheapest gas is still along the Gulf Coast: Texas averages $3.929 and Houston $3.86. The dearest is on the West Coast, with California at $6.003 and Los Angeles at $5.98. The Midwest had the biggest weekly jump, 29.5 cents to $4.386.
Timeline: the Hormuz disruption and the gas price, updated September 29
Newest first. We add an entry when the oil flow, the official data or the pump price moves.
- Tuesday, September 29 (due)The EIA publishes the national gas price for the week of September 28; IMF PortWatch adds satellite counts through September 27.
- Monday, September 28Kpler data reported by Reuters: Middle East crude exports at 12.8 million barrels a day in September, the highest since the war began; crude through Hormuz on track for about 7.4 million. Brent futures rise about 4% after the rejected Iranian plan (CNBC).
- Sunday, September 27Energy Secretary Chris Wright says the running average through the strait is "almost 13 million barrels a day". The JMIC keeps the strait at severe, with about 30 U.S.-facilitated transits a day.
- Saturday, September 26President Trump rejects Iran's offer to reopen the strait within seven days if the U.S. lifts its naval blockade and oil sanctions; Tehran says it will keep its conditions.
- Friday, September 25Kpler counts 33.7 million barrels of crude out through Hormuz since September 20, on 19 tankers, 17 of them supertankers.
- Tuesday, September 22Saudi Arabia's East-West pipeline restarts at a reduced rate, industry sources report. EIA: regular at $4.478 for the week of September 21, up 15.9 cents in a week; diesel at a record $6.529.
- Tuesday, September 15Brent spot reaches $130.80 a barrel (EIA), its highest since April.
- September 10–11Pumping stations on the East-West pipeline, the main Saudi route around Hormuz, are damaged (JMIC).
- Friday, September 11IEA Oil Market Report: Gulf exports about 13 million barrels a day in August, nearly half the prewar level.
- Wednesday, September 9EIA outlook: 6.7 million barrels a day of Middle East crude shut in during August, up from 5.0 million in July.
- AugustThe U.S. blockade on Iran's oil exports is renewed (EIA). Satellite counts fall back to 4.7 ships a day on average (IMF PortWatch).
- Monday, July 6Regular bottoms out at $3.777 after the mid-June U.S.-Iran memorandum; June was the busiest month in the strait since the war began, at 12.9 ships a day on satellite counts. Fighting resumes in early July.
- Monday, May 11Regular peaks for the year so far at $4.500 a gallon.
- Tuesday, April 7Brent spot hits $138.21 a barrel, its 2026 high (EIA).
- Wednesday, March 11IEA member countries agree to release 400 million barrels from emergency stocks.
- Monday, March 9Regular jumps to $3.502, up 48.7 cents in a week.
- Saturday, February 28The conflict with Iran begins. Satellite counts drop from 57 ships that day to 4 on March 2 (IMF PortWatch).
- Monday, February 23Last reading before the conflict: regular $2.937, diesel $3.809 (EIA).
How to follow the Hormuz oil flow yourself
No single source is complete. These are the ones we check, what each is good for, and when it updates.
1Satellite ship counts: IMF PortWatch, every Tuesday
The International Monetary Fund's Strait of Hormuz page shows daily transits by ship type since 2019, updated weekly on Tuesdays. It is free and consistent over time, but it only sees ships with transponders on, so treat it as a trend, not a total.
2Security and transit numbers: JMIC advisories
The Joint Maritime Information Center publishes advisory updates for shipping every few days through the UKMTO website, with the threat level, the number of U.S.-facilitated transits and the status of bypass pipelines. MARAD's U.S. Maritime Advisories say which rules apply to U.S. ships.
3Barrels: IEA and EIA monthly reports
The IEA's monthly Oil Market Report and the EIA's Short-Term Energy Outlook (next on October 6) give the official estimates of Gulf exports and shut-in production. Barrel counts from Kpler or Vortexa are faster, but they are commercial, preliminary and reach the public through the press.
4The pump: EIA weekly prices
The EIA's weekly survey is what this site publishes. Check your region, your city or the long-run history to see how far today's price is from the 2022 record.
Will gas prices go down?
This week's wholesale signal for gasoline, diesel and Brent, with its dates
Why are gas prices so high?
The national average split into crude, refining, taxes and margin
Diesel prices this week
The national diesel average at a record, region by region
Gas prices by region
The EIA's weekly average for the East Coast, Midwest, Gulf Coast, Rockies and West Coast
Gas price history
Every weekly average since 1990, with the $5.006 record of June 2022
Gas tax by state
The part of the price that does not move with oil
Where these figures come from
Prices and forecasts from the EIA, flow estimates from the IEA, transit and security data from the JMIC and IMF PortWatch. Private tanker-tracking figures are named and attributed. Per-gallon calculations are ours.
- U.S. Energy Information Administration, Gasoline and Diesel Fuel Update, release of September 22, 2026 (week of September 21) – eia.gov; weekly U.S. regular gasoline series – eia.gov; Europe Brent spot price, daily – eia.gov
- U.S. Energy Information Administration, Short-Term Energy Outlook, September 9, 2026 – eia.gov; "Amid regional conflict, the Strait of Hormuz remains critical oil chokepoint", June 16, 2025 – eia.gov
- International Energy Agency, Oil Market Report, September 2026 (published September 11) – iea.org; Strait of Hormuz factsheet – iea.org; collective action of March 11, 2026 – iea.org
- Joint Maritime Information Center, Update 100 to JMIC Advisory Note, 01 March – 27 September 2026 – ukmto.org (PDF)
- U.S. Maritime Administration, U.S. Maritime Advisory 2026-011, Persian Gulf, Strait of Hormuz and Gulf of Oman – maritime.dot.gov
- IMF PortWatch, Daily Chokepoint Transit Calls, Strait of Hormuz, data to September 20, 2026 – portwatch.imf.org
- Kpler data as reported by Reuters: "Crude oil exports via Hormuz at 33.7 million barrels this week", September 25, 2026 – MarineLink; "Mideast oil exports rebound in September as Saudi Arabia boosts shipments", September 28, 2026 – Yahoo Finance
- Energy Secretary Chris Wright on Fox News, September 27, 2026, as reported by Kurdistan24; Iran's plan and its rejection on September 26: NPR; Kpler monthly figures and U.S. estimates compared: Al Jazeera
- Strait dimensions: NASA Earth Observatory caption of the MODIS image of December 2, 2020 – Wikimedia Commons
- State and city prices: this site's EIA-based pages, week of September 21, 2026 – where the numbers come from
Published
By Gas Price Radar newsroom
We publish the U.S. Energy Information Administration's weekly gas and diesel prices for every state, region and city, and follow the official data that explains why they move.
Sources: U.S. Energy Information Administration (Gasoline and Diesel Fuel Update, release of September 22, 2026; Short-Term Energy Outlook of September 9, 2026; daily Brent and Gulf Coast gasoline spot prices), International Energy Agency Oil Market Report, September 2026, Joint Maritime Information Center, Update 100 of September 27, 2026, MARAD U.S. Maritime Advisories and IMF PortWatch daily transit counts to September 20, 2026. Kpler tanker-tracking figures as reported by Reuters on September 25 and 28; the Energy Secretary's estimate as reported on September 27. Per-gallon and per-tank calculations are our own. Satellite image: MODIS Land Rapid Response Team, NASA Goddard Space Flight Center, public domain, via Wikimedia Commons. How our prices work: Where the numbers come from.